User:QuailWatts/sandbox6
From Wikipedia, the free encyclopedia
This is a concept page for U.S. elections if the margin of vote to appear on an infobox is moved from 5% to 2%.
Quick Facts Turnout, Nominee ...
| |||||||||||||||||||||||||||||||||
| Turnout | 62.65%[1] | ||||||||||||||||||||||||||||||||
|---|---|---|---|---|---|---|---|---|---|---|---|---|---|---|---|---|---|---|---|---|---|---|---|---|---|---|---|---|---|---|---|---|---|
| |||||||||||||||||||||||||||||||||
 County results
| |||||||||||||||||||||||||||||||||
| |||||||||||||||||||||||||||||||||
.jpg)
.jpg)
.jpg)
Close
Quick Facts 538 members of the Electoral College 270 electoral votes needed to win, Turnout ...
| |||||||||||||||||||||||||||||||||||||
538 members of the Electoral College 270 electoral votes needed to win | |||||||||||||||||||||||||||||||||||||
|---|---|---|---|---|---|---|---|---|---|---|---|---|---|---|---|---|---|---|---|---|---|---|---|---|---|---|---|---|---|---|---|---|---|---|---|---|---|
| Opinion polls | |||||||||||||||||||||||||||||||||||||
| Turnout | 55.7%[2] | ||||||||||||||||||||||||||||||||||||
| |||||||||||||||||||||||||||||||||||||
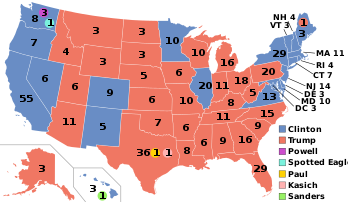 Presidential election results map. Red denotes states won by Trump/Pence (R) and blue denotes those won by Clinton/Kaine (D). Numbers indicate electoral votes cast by each state and the District of Columbia. On election night, Trump won 306 electors and Clinton 232. However, because of seven faithless electors (five Democratic and two Republican), Trump received just 304 votes to Clinton's 227. | |||||||||||||||||||||||||||||||||||||
| |||||||||||||||||||||||||||||||||||||


Close
Quick Facts Turnout, Nominee ...
| |||||||||||||||||||||||||||||
| Turnout | 33.2% | ||||||||||||||||||||||||||||
|---|---|---|---|---|---|---|---|---|---|---|---|---|---|---|---|---|---|---|---|---|---|---|---|---|---|---|---|---|---|
| |||||||||||||||||||||||||||||
 County results Cuomo: 40–50% 50–60% 70–80% 80–90% Astorino: 40–50% 50–60% 60–70% 70–80% | |||||||||||||||||||||||||||||
| |||||||||||||||||||||||||||||
.jpg)

.jpg)
Close
Quick Facts Nominee, Party ...
| |||||||||||||||||||||||||||||||||
| |||||||||||||||||||||||||||||||||
 County Results
| |||||||||||||||||||||||||||||||||
| |||||||||||||||||||||||||||||||||


.jpg)
Close
Quick Facts Turnout, Nominee ...
| |||||||||||||||||||||||||||||||||||||
538 members of the Electoral College[lower-alpha 2] 270 electoral votes needed to win | |||||||||||||||||||||||||||||||||||||
|---|---|---|---|---|---|---|---|---|---|---|---|---|---|---|---|---|---|---|---|---|---|---|---|---|---|---|---|---|---|---|---|---|---|---|---|---|---|
| Turnout | 51.2%[4] | ||||||||||||||||||||||||||||||||||||
| |||||||||||||||||||||||||||||||||||||
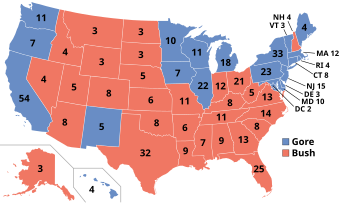 Presidential election results map. Red denotes states won by Bush/Cheney and blue denotes those won by Gore/Lieberman. One of D.C.'s three electors abstained from casting a vote for president or vice president. Numbers indicate electoral votes cast by each state and the District of Columbia. | |||||||||||||||||||||||||||||||||||||
| |||||||||||||||||||||||||||||||||||||


Close
Quick Facts Nominee, Party ...
| |||||||||||||||||||||||||||||||||||||||||||||||||||||||
| |||||||||||||||||||||||||||||||||||||||||||||||||||||||
 County Results
| |||||||||||||||||||||||||||||||||||||||||||||||||||||||
| |||||||||||||||||||||||||||||||||||||||||||||||||||||||
.jpg)


Close
Quick Facts 531 members of the Electoral College 266 electoral votes needed to win, Turnout ...
| |||||||||||||||||||||||||||||||||||||||||||||||||||||||||||||
531 members of the Electoral College 266 electoral votes needed to win | |||||||||||||||||||||||||||||||||||||||||||||||||||||||||||||
|---|---|---|---|---|---|---|---|---|---|---|---|---|---|---|---|---|---|---|---|---|---|---|---|---|---|---|---|---|---|---|---|---|---|---|---|---|---|---|---|---|---|---|---|---|---|---|---|---|---|---|---|---|---|---|---|---|---|---|---|---|---|
| Turnout | 53.0%[5] | ||||||||||||||||||||||||||||||||||||||||||||||||||||||||||||
| |||||||||||||||||||||||||||||||||||||||||||||||||||||||||||||
 Presidential election results map. Red denotes states won by Dewey/Warren, blue denotes those won by Truman/Barkley, orange denotes those won by Thurmond/Wright, including a Tennessee faithless elector. Numbers indicate the number of electoral votes allotted to each state. | |||||||||||||||||||||||||||||||||||||||||||||||||||||||||||||
| |||||||||||||||||||||||||||||||||||||||||||||||||||||||||||||


.jpg)
Close
- ("Official 2016 Presidential General Election Results" (PDF). Federal Election Commission. December 2017. Retrieved February 12, 2018.) ("Voting and Registration in the Election of November 2016". United States Census Bureau. May 2017. Retrieved November 10, 2017.)
- "FEDERAL ELECTIONS 2016 -- Election Results for the U.S. President, the U.S. Senate and the U.S. House of Representatives" (PDF). Federal Elections Commission. December 2017. Retrieved August 12, 2020.
- "Voter Turnout in Presidential Elections". Presidency.ucsb.edu. Archived from the original on September 24, 2018. Retrieved August 18, 2016.
- "Voter Turnout in Presidential Elections". The American Presidency Project. UC Santa Barbara.
- In state-by-state tallies, Trump earned 306 pledged electors, Clinton 232. They lost respectively two and five votes to faithless electors. Vice presidential candidates Pence and Kaine lost one and five votes, respectively. Three other votes by electors were invalidated and recast.
- Electors were elected to all 538 apportioned positions; however, an elector from the District of Columbia pledged to the Gore/Lieberman ticket abstained from casting a vote for president or vice president, bringing the total number of electoral votes cast to 537.
- 267 electors pledged to the Gore/Lieberman ticket were elected; however, an elector from the District of Columbia abstained from casting a vote for president or vice president, bringing the ticket's total number of electoral votes to 266.
Quick Facts 531 members of the Electoral College 266 electoral votes needed to win, Turnout ...
| |||||||||||||||||||||||||||||||||||||
531 members of the Electoral College 266 electoral votes needed to win | |||||||||||||||||||||||||||||||||||||
|---|---|---|---|---|---|---|---|---|---|---|---|---|---|---|---|---|---|---|---|---|---|---|---|---|---|---|---|---|---|---|---|---|---|---|---|---|---|
| Turnout | 52.6%[1] | ||||||||||||||||||||||||||||||||||||
| |||||||||||||||||||||||||||||||||||||
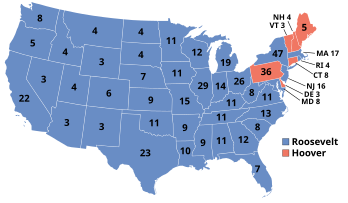 Presidential election results map. Blue denotes those won by Roosevelt/Garner, red denotes states won by Hoover/Curtis. Numbers indicate the number of electoral votes allotted to each state. | |||||||||||||||||||||||||||||||||||||
| |||||||||||||||||||||||||||||||||||||


Close
Quick Facts 531 members of the Electoral College 266 electoral votes needed to win, Turnout ...
| |||||||||||||||||||||||||||||||||||||
531 members of the Electoral College 266 electoral votes needed to win | |||||||||||||||||||||||||||||||||||||
|---|---|---|---|---|---|---|---|---|---|---|---|---|---|---|---|---|---|---|---|---|---|---|---|---|---|---|---|---|---|---|---|---|---|---|---|---|---|
| Turnout | 49.2%[2] | ||||||||||||||||||||||||||||||||||||
| |||||||||||||||||||||||||||||||||||||
 Presidential election results map. Red denotes states won by Harding/Coolidge, blue denotes those won by Cox/Roosevelt. Numbers indicate the number of electoral votes allotted to each state. | |||||||||||||||||||||||||||||||||||||
| |||||||||||||||||||||||||||||||||||||

.jpg)
.jpg)
Close
- "Voter Turnout in Presidential Elections". The American Presidency Project. UC Santa Barbara.
- "Voter Turnout in Presidential Elections". The American Presidency Project. UC Santa Barbara.
Quick Facts 531 members of the Electoral College 266 electoral votes needed to win, Turnout ...
| |||||||||||||||||||||||||||||||||||||
531 members of the Electoral College 266 electoral votes needed to win | |||||||||||||||||||||||||||||||||||||
|---|---|---|---|---|---|---|---|---|---|---|---|---|---|---|---|---|---|---|---|---|---|---|---|---|---|---|---|---|---|---|---|---|---|---|---|---|---|
| Turnout | 61.6%[1] | ||||||||||||||||||||||||||||||||||||
| |||||||||||||||||||||||||||||||||||||
 Presidential election results map. Blue denotes those won by Wilson/Marshall, red denotes states won by Hughes/Fairbanks. Numbers indicate the number of electoral votes allotted to each state. | |||||||||||||||||||||||||||||||||||||
| |||||||||||||||||||||||||||||||||||||


_circa_1915.jpg)
Close
Quick Facts 483 members of the Electoral College 242 electoral votes needed to win, Turnout ...
| |||||||||||||||||||||||||||||||||||||
483 members of the Electoral College 242 electoral votes needed to win | |||||||||||||||||||||||||||||||||||||
|---|---|---|---|---|---|---|---|---|---|---|---|---|---|---|---|---|---|---|---|---|---|---|---|---|---|---|---|---|---|---|---|---|---|---|---|---|---|
| Turnout | 65.4%[2] | ||||||||||||||||||||||||||||||||||||
| |||||||||||||||||||||||||||||||||||||
 Presidential election results map. Red denotes those won by Taft/Sherman, blue denotes states won by Bryan/Kern. Numbers indicate the number of electoral votes allotted to each state. | |||||||||||||||||||||||||||||||||||||
| |||||||||||||||||||||||||||||||||||||


Close
Quick Facts 476 members of the Electoral College 239 electoral votes needed to win, Turnout ...
| |||||||||||||||||||||||||||||||||||||
476 members of the Electoral College 239 electoral votes needed to win | |||||||||||||||||||||||||||||||||||||
|---|---|---|---|---|---|---|---|---|---|---|---|---|---|---|---|---|---|---|---|---|---|---|---|---|---|---|---|---|---|---|---|---|---|---|---|---|---|
| Turnout | 65.2%[3] | ||||||||||||||||||||||||||||||||||||
| |||||||||||||||||||||||||||||||||||||
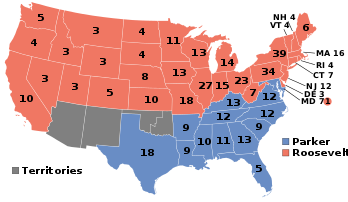 Presidential election results map. Red denotes those won by Roosevelt/Fairbanks, blue denotes states won by Parker/Davis. Numbers indicate the number of electoral votes allotted to each state. | |||||||||||||||||||||||||||||||||||||
| |||||||||||||||||||||||||||||||||||||


Close
Quick Facts 444 members of the Electoral College 223 electoral votes needed to win, Turnout ...
| |||||||||||||||||||||||||||||||||||||||||||||||||||||||||||||
444 members of the Electoral College 223 electoral votes needed to win | |||||||||||||||||||||||||||||||||||||||||||||||||||||||||||||
|---|---|---|---|---|---|---|---|---|---|---|---|---|---|---|---|---|---|---|---|---|---|---|---|---|---|---|---|---|---|---|---|---|---|---|---|---|---|---|---|---|---|---|---|---|---|---|---|---|---|---|---|---|---|---|---|---|---|---|---|---|---|
| Turnout | 74.7%[4] | ||||||||||||||||||||||||||||||||||||||||||||||||||||||||||||
| |||||||||||||||||||||||||||||||||||||||||||||||||||||||||||||
 Presidential election results map. Red denotes states won by Harrison/Reid, blue denotes those won by Cleveland/Stevenson, green denotes those won by Weaver/Field. Numbers indicate the number of electoral votes allotted to each state. | |||||||||||||||||||||||||||||||||||||||||||||||||||||||||||||
| |||||||||||||||||||||||||||||||||||||||||||||||||||||||||||||


Close
- "Voter Turnout in Presidential Elections". The American Presidency Project. UC Santa Barbara.
- "Voter Turnout in Presidential Elections". The American Presidency Project. UC Santa Barbara.
- "Voter Turnout in Presidential Elections". The American Presidency Project. UC Santa Barbara.
- "Voter Turnout in Presidential Elections". The American Presidency Project. UC Santa Barbara.
Quick Facts 401 members of the Electoral College 201 electoral votes needed to win, Turnout ...
| |||||||||||||||||||||||||||||||||||||
401 members of the Electoral College 201 electoral votes needed to win | |||||||||||||||||||||||||||||||||||||
|---|---|---|---|---|---|---|---|---|---|---|---|---|---|---|---|---|---|---|---|---|---|---|---|---|---|---|---|---|---|---|---|---|---|---|---|---|---|
| Turnout | 79.3%[1] | ||||||||||||||||||||||||||||||||||||
| |||||||||||||||||||||||||||||||||||||
 Presidential election results map. Red denotes those won by Harrison/Morton, blue denotes states won by Cleveland/Thurman. Numbers indicate the number of electoral votes allotted to each state. | |||||||||||||||||||||||||||||||||||||
| |||||||||||||||||||||||||||||||||||||


Close
- "Voter Turnout in Presidential Elections". The American Presidency Project. UC Santa Barbara.