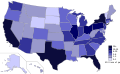
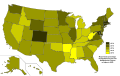
- Map of each state's population as of 2013
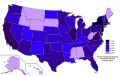
- Map of states showing population density in 2013
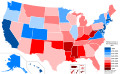
- U.S. states' population change from 2010 to 2013
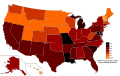
- Map of states showing CO2 emission per capita in 2011
- Map of each state's vehicles per 1,000 people in 2007
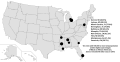
- Map of each state's billionaires as of 2014
- Comparison between the U.S states and countries by GDP in 2012
- Map of states showing number of gun murders in 2010
- Gun owners as a percentage of each state's population in 2007
- Map of the American Human Development Index rating within the United States, 2013-2014 report
- Asian American population percentage by state in 2010
- Cities with the highest percentage of Blacks or African Americans in 2010
- Cities with the highest percentage of LGBs in 2006
- LGBT Adult Percentage by State in 2012
- Map of states by median family income in 2014
- Map of states by median household income in 2014
- Map of states percentage of population with Advanced Degree in 2009
- Map of states percentage of population with Bachelor's Degree or Higher in 2009
- Map of U.S. states by GDP in U.S. dollars (2015, February)
- Map of U.S. states by GDP per capita in U.S. dollars (2012)
- Map of states with percent change in economic growth in 2013
- Map of U.S. states by total fertility rate (TFR) in 2013
- Percent of Hispanic and Latino population by state in 2012
- Percent of population claiming Asian Indian ethnicity by state in 2010
- White Non-Hispanic population percentage by state in 2012


.svg)
.svg)

_in_2013.svg)


