File:Life_Expectancy_At_Birth_By_Region.png
From Wikipedia, the free encyclopedia
Size of this preview: 800 × 439 pixels. Other resolutions: 320 × 176 pixels | 640 × 351 pixels | 973 × 534 pixels.
Original file (973 × 534 pixels, file size: 69 KB, MIME type: image/png)
| This is a file from the Wikimedia Commons. Information from its description page there is shown below. Commons is a freely licensed media file repository. You can help. |
Summary
| DescriptionLife Expectancy At Birth By Region.png |
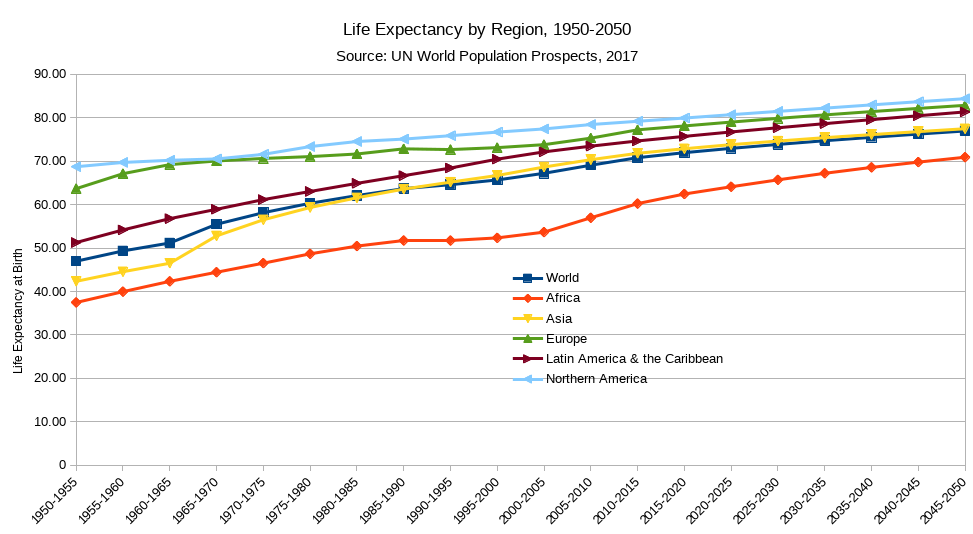
English: Chart depicting trends (prospective)in life expectancy at birth, for various regions of the world and for the world, over a century (1950 to 2050). Data source: World Population Prospects 2017; UN). Thanks to the progress of public health, most countries (especially developing countries) are progressing, but towards a common threshold. Note: factors related to possible wars, epidemics or new factors such as the collapse of biodiversity and/or the climate crisis are sources of significant uncertainties for this type of prospective, not taken into account in this graph. Life expectancy in good health, or without disability is also more difficult to predict
Français : Graphique présentant la tendance (prospective) en matière d'évolution de l'espérance de vie à la naissance, pour diverses régions du monde et pour le monde, sur un siècle : de 1950 à 2050. Source des données : World Population Prospects 2017 ; ONU). Grâce aux progrès de la santé publique, la plupart des pays (surtout les pays en développement) progressent, mais vers un seuil commun. Remarque : des facteurs liés à d'éventuelles guerres, épidémies ou des facteurs nouveaux tels que l'effondrement de la biodiversité et/ou la crise climatique sont sources d'incertitudes importantes pour ce type de prospective, non prises en compte dans ce graphe. L'espérance de vie en bonne santé, ou sans incapacité est également plus difficile à prévoir
Español: Gráfico que muestra la tendencia (prospectiva) en la esperanza de vida al nacer, para varias regiones del mundo y para el mundo, durante un siglo: desde 1950 hasta 2050. Fuente de datos: World Population Prospects 2017; ONU). Gracias al progreso de la salud pública, la mayoría de los países (especialmente los países en desarrollo) están progresando, pero hacia un umbral común. Nota: los factores relacionados con posibles guerras, epidemias o nuevos factores, como el colapso de la biodiversidad y / o la crisis climática, son fuentes de incertidumbres importantes para este tipo de prospectivas, que no se tienen en cuenta en este gráfico. La esperanza de vida con buena salud o sin discapacidad también es más difícil de predecir.
Nederlands: Grafiek die de (toekomstige) trend in levensverwachting bij geboorte toont, voor verschillende regio's van de wereld en voor de wereld, meer dan een eeuw: van 1950 tot 2050. Gegevensbron: Wereldbevolking Vooruitzichten 2017; VN). Dankzij de vooruitgang van de volksgezondheid zijn de meeste landen (met name ontwikkelingslanden) aan het evolueren, maar op weg naar een gemeenschappelijke drempel. Opmerking: factoren die verband houden met mogelijke oorlogen, epidemieën of nieuwe factoren zoals de ineenstorting van de biodiversiteit en / of de klimaatcrisis zijn bronnen van significante onzekerheden voor dit soort prospectieven, waarmee in deze grafiek geen rekening wordt gehouden. Levensverwachting in goede gezondheid of zonder beperking is ook moeilijker te voorspellen.
Deutsch: Diagramm, das den (voraussichtlichen) Trend der Lebenserwartung bei der Geburt für verschiedene Regionen der Welt und für die Welt über ein Jahrhundert zeigt: von 1950 bis 2050. Datenquelle: World Population Prospects 2017; UN). Dank der Fortschritte im Bereich der öffentlichen Gesundheit machen die meisten Länder (insbesondere Entwicklungsländer) Fortschritte, erreichen jedoch eine gemeinsame Schwelle. Hinweis: Faktoren im Zusammenhang mit möglichen Kriegen, Epidemien oder neuen Faktoren wie dem Zusammenbruch der Biodiversität und / oder der Klimakrise führen zu erheblichen Unsicherheiten für diese Art von Prospektiven, die in dieser Grafik nicht berücksichtigt werden. Die Lebenserwartung bei guter Gesundheit oder ohne Behinderung ist auch schwieriger vorherzusagen. |
| Date | |
| Source | Own work |
| Author | ODogerall |
Licensing
I, the copyright holder of this work, hereby publish it under the following license:
This file is licensed under the Creative Commons Attribution-Share Alike 4.0 International license.
- You are free:
- to share – to copy, distribute and transmit the work
- to remix – to adapt the work
- Under the following conditions:
- attribution – You must give appropriate credit, provide a link to the license, and indicate if changes were made. You may do so in any reasonable manner, but not in any way that suggests the licensor endorses you or your use.
- share alike – If you remix, transform, or build upon the material, you must distribute your contributions under the same or compatible license as the original.
Captions
Add a one-line explanation of what this file represents
Items portrayed in this file
depicts
26 January 2018
File history
Click on a date/time to view the file as it appeared at that time.
| Date/Time | Thumbnail | Dimensions | User | Comment | |
|---|---|---|---|---|---|
| current | 13:49, 26 January 2018 | | 973 × 534 (69 KB) | ODogerall | User created page with UploadWizard |
File usage
The following pages on the English Wikipedia use this file (pages on other projects are not listed):
Global file usage
The following other wikis use this file:
- Usage on fa.wikipedia.org
- Usage on fr.wikipedia.org
- Usage on ko.wikipedia.org
- Usage on la.wikipedia.org
- Usage on or.wikipedia.org
- Usage on sq.wikipedia.org
- Usage on tr.wikipedia.org
Metadata
This file contains additional information, probably added from the digital camera or scanner used to create or digitize it.
If the file has been modified from its original state, some details may not fully reflect the modified file.
| Horizontal resolution | 37.79 dpc |
|---|---|
| Vertical resolution | 37.77 dpc |