File:Calibration_curve.png
From Wikipedia, the free encyclopedia
Size of this preview: 800 × 480 pixels. Other resolutions: 320 × 192 pixels | 1,024 × 614 pixels | 1,280 × 768 pixels | 2,000 × 1,200 pixels.
Original file (2,000 × 1,200 pixels, file size: 25 KB, MIME type: image/png)
| This is a file from the Wikimedia Commons. Information from its description page there is shown below. Commons is a freely licensed media file repository. You can help. |
Summary
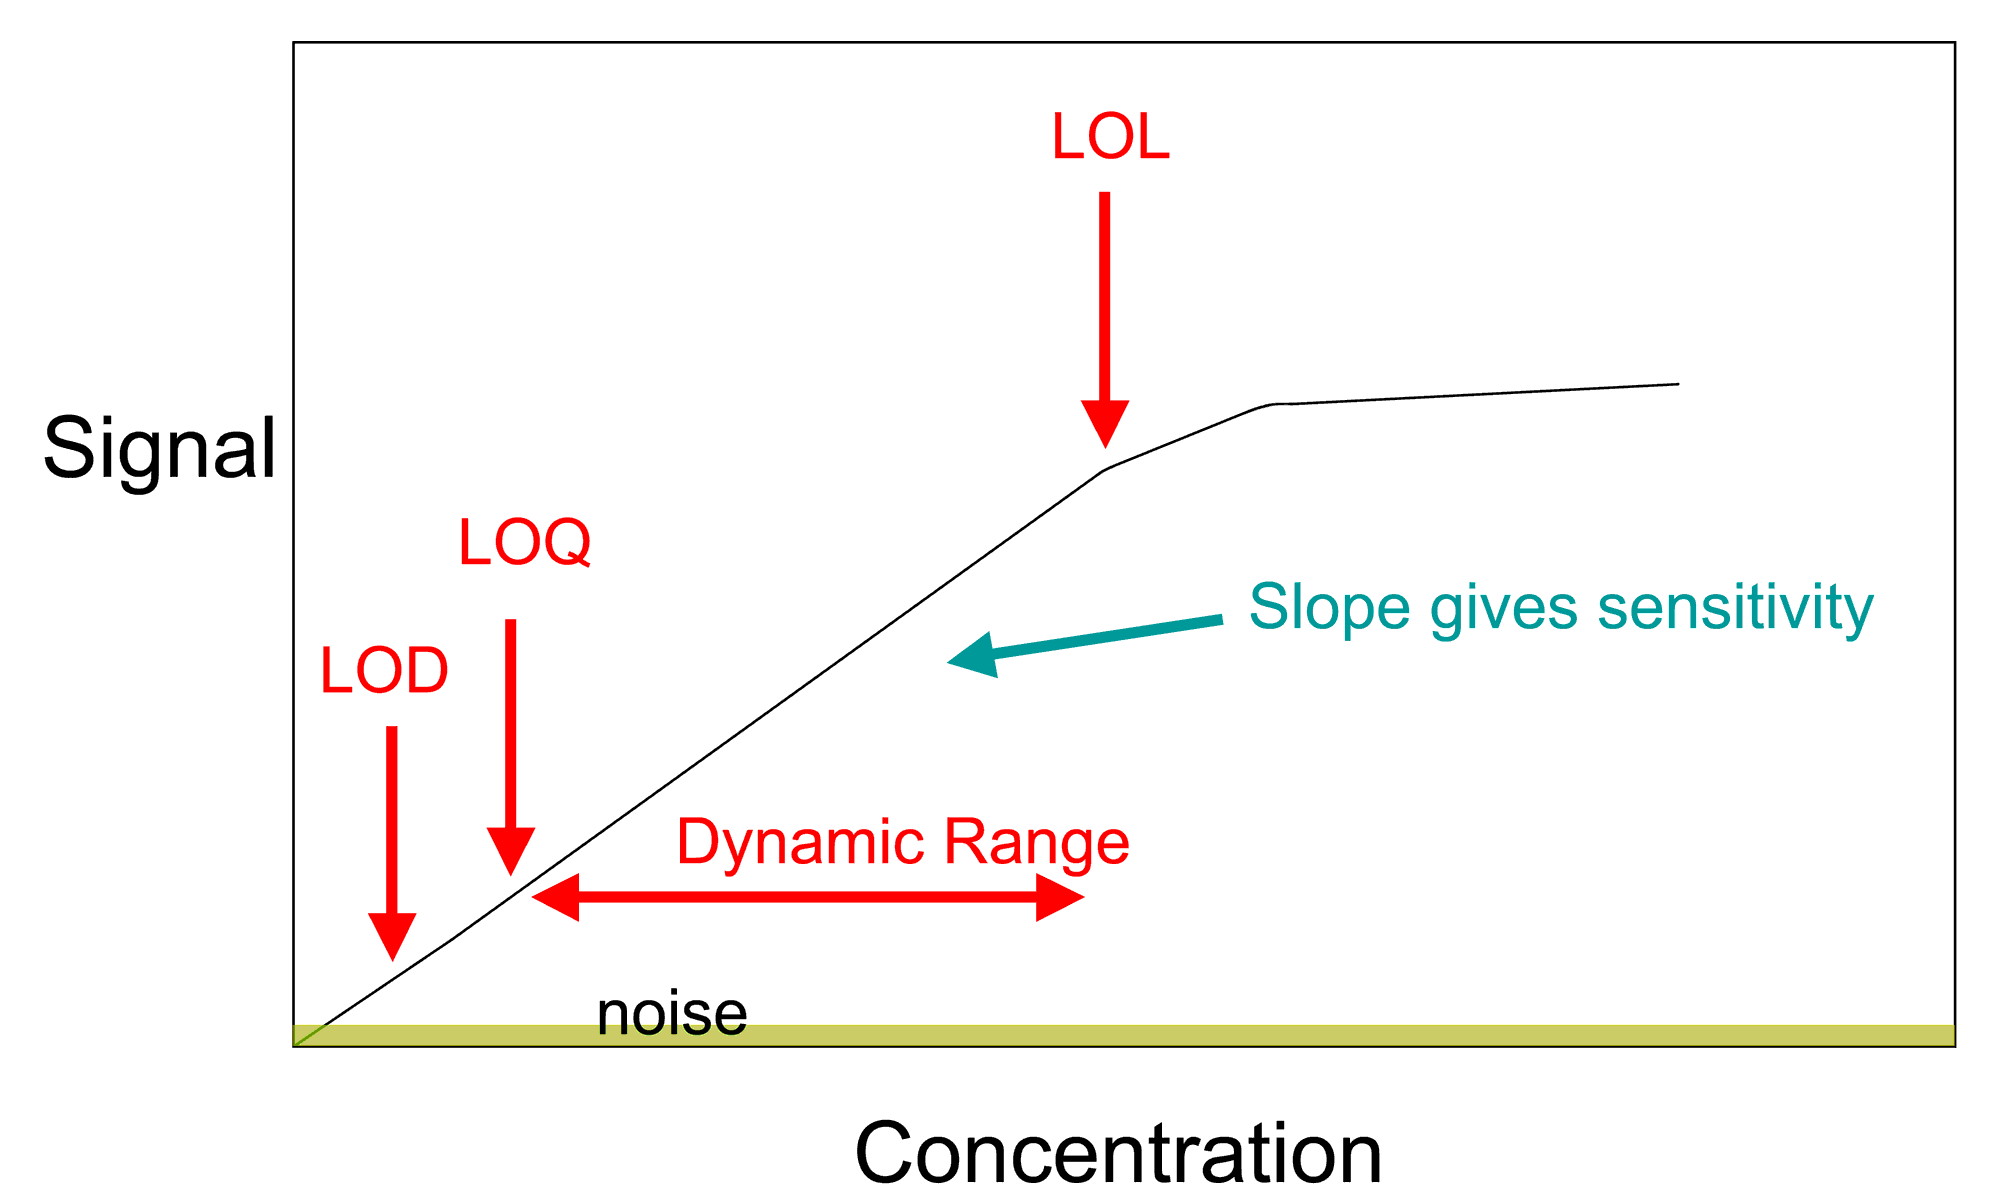
| DescriptionCalibration curve.png | Schematic of a calibration curve plot showing limit of detection (LOD), limit of quantification (LOQ), dynamic range, and limit of linearity (LOL). |
| Date | |
| Source | Own work |
| Author | Kkmurray |
Licensing
I, the copyright holder of this work, hereby publish it under the following licenses:

|
Permission is granted to copy, distribute and/or modify this document under the terms of the GNU Free Documentation License, Version 1.2 or any later version published by the Free Software Foundation; with no Invariant Sections, no Front-Cover Texts, and no Back-Cover Texts. A copy of the license is included in the section entitled GNU Free Documentation License.http://www.gnu.org/copyleft/fdl.htmlGFDLGNU Free Documentation Licensetruetrue |
This file is licensed under the Creative Commons Attribution-Share Alike 3.0 Unported license.
- You are free:
- to share – to copy, distribute and transmit the work
- to remix – to adapt the work
- Under the following conditions:
- attribution – You must give appropriate credit, provide a link to the license, and indicate if changes were made. You may do so in any reasonable manner, but not in any way that suggests the licensor endorses you or your use.
- share alike – If you remix, transform, or build upon the material, you must distribute your contributions under the same or compatible license as the original.
You may select the license of your choice.
Original upload log
| Date/Time | Dimensions | User | Comment |
|---|---|---|---|
| 21 September 2007, 19:40:38 | 2000 × 1200 (31856 bytes) | Kkmurray (talk · contribs) | {{Information |Description=Schematic of a calibration curve plot showing limit of detection (LOD), limit of quantification (LOQ), dynamic range, and limit of linearity (LOL). |Source=self-made |Date=September 21, 2007 |Author= [[User:Kkmurray|Kkmurray]] |
Captions
Add a one-line explanation of what this file represents
Items portrayed in this file
depicts
21 September 2007
image/png
f56342dc9ca838d83fcce0b3eba8d764dd43e488
25,340 byte
1,200 pixel
2,000 pixel
File history
Click on a date/time to view the file as it appeared at that time.
| Date/Time | Thumbnail | Dimensions | User | Comment | |
|---|---|---|---|---|---|
| current | 04:00, 29 August 2014 | | 2,000 × 1,200 (25 KB) | GifTagger | Bot: Converting file to superior PNG file. (Source: Calibration_curve.gif). This GIF was problematic due to non-greyscale color table. |
File usage
The following pages on the English Wikipedia use this file (pages on other projects are not listed):
Global file usage
The following other wikis use this file:
- Usage on azb.wikipedia.org
- Usage on bs.wikipedia.org
- Usage on ca.wikipedia.org
- Usage on es.wikipedia.org
- Usage on et.wikipedia.org
- Usage on eu.wikipedia.org
- Usage on fa.wikipedia.org
- Usage on id.wikipedia.org
- Usage on ro.wikipedia.org
- Usage on sh.wikipedia.org
- Usage on sq.wikipedia.org
- Usage on sr.wikipedia.org
- Usage on ta.wikipedia.org
Retrieved from "https://en.wikipedia.org/wiki/File:Calibration_curve.png"